
How Long is the Coast of Sweden?
As a space systems engineer, my main job is to design satellites which can reliably carry payloads from Earth all the way beyond the Karman line and, well, not fail when they reach there, so customers can be happy. To a certain extent, I can abstract myself from whatever it is that the payload will do up there and mind my own business (which is still a lot of work) on the “carrier” side of the question, as long as I get to know the main interfaces and more or less the concept of operations. Just like truck designers do not have to really worry much about what is going to actually be hauled once the trucks roll out of the factory as long as they design for generic volumes and masses.
But no, I can’t do that, it is against my engineering nature. I like to dive deeper and try to understand what the actual application is; payloads exist because there is an underlying application with a business case1 requiring such artefact riding on top of a satellite. It frequently boils down to basically two main ones: data communications and Earth Observation (or as some call it, Remote Sensing2). Today I will analyze the latter.
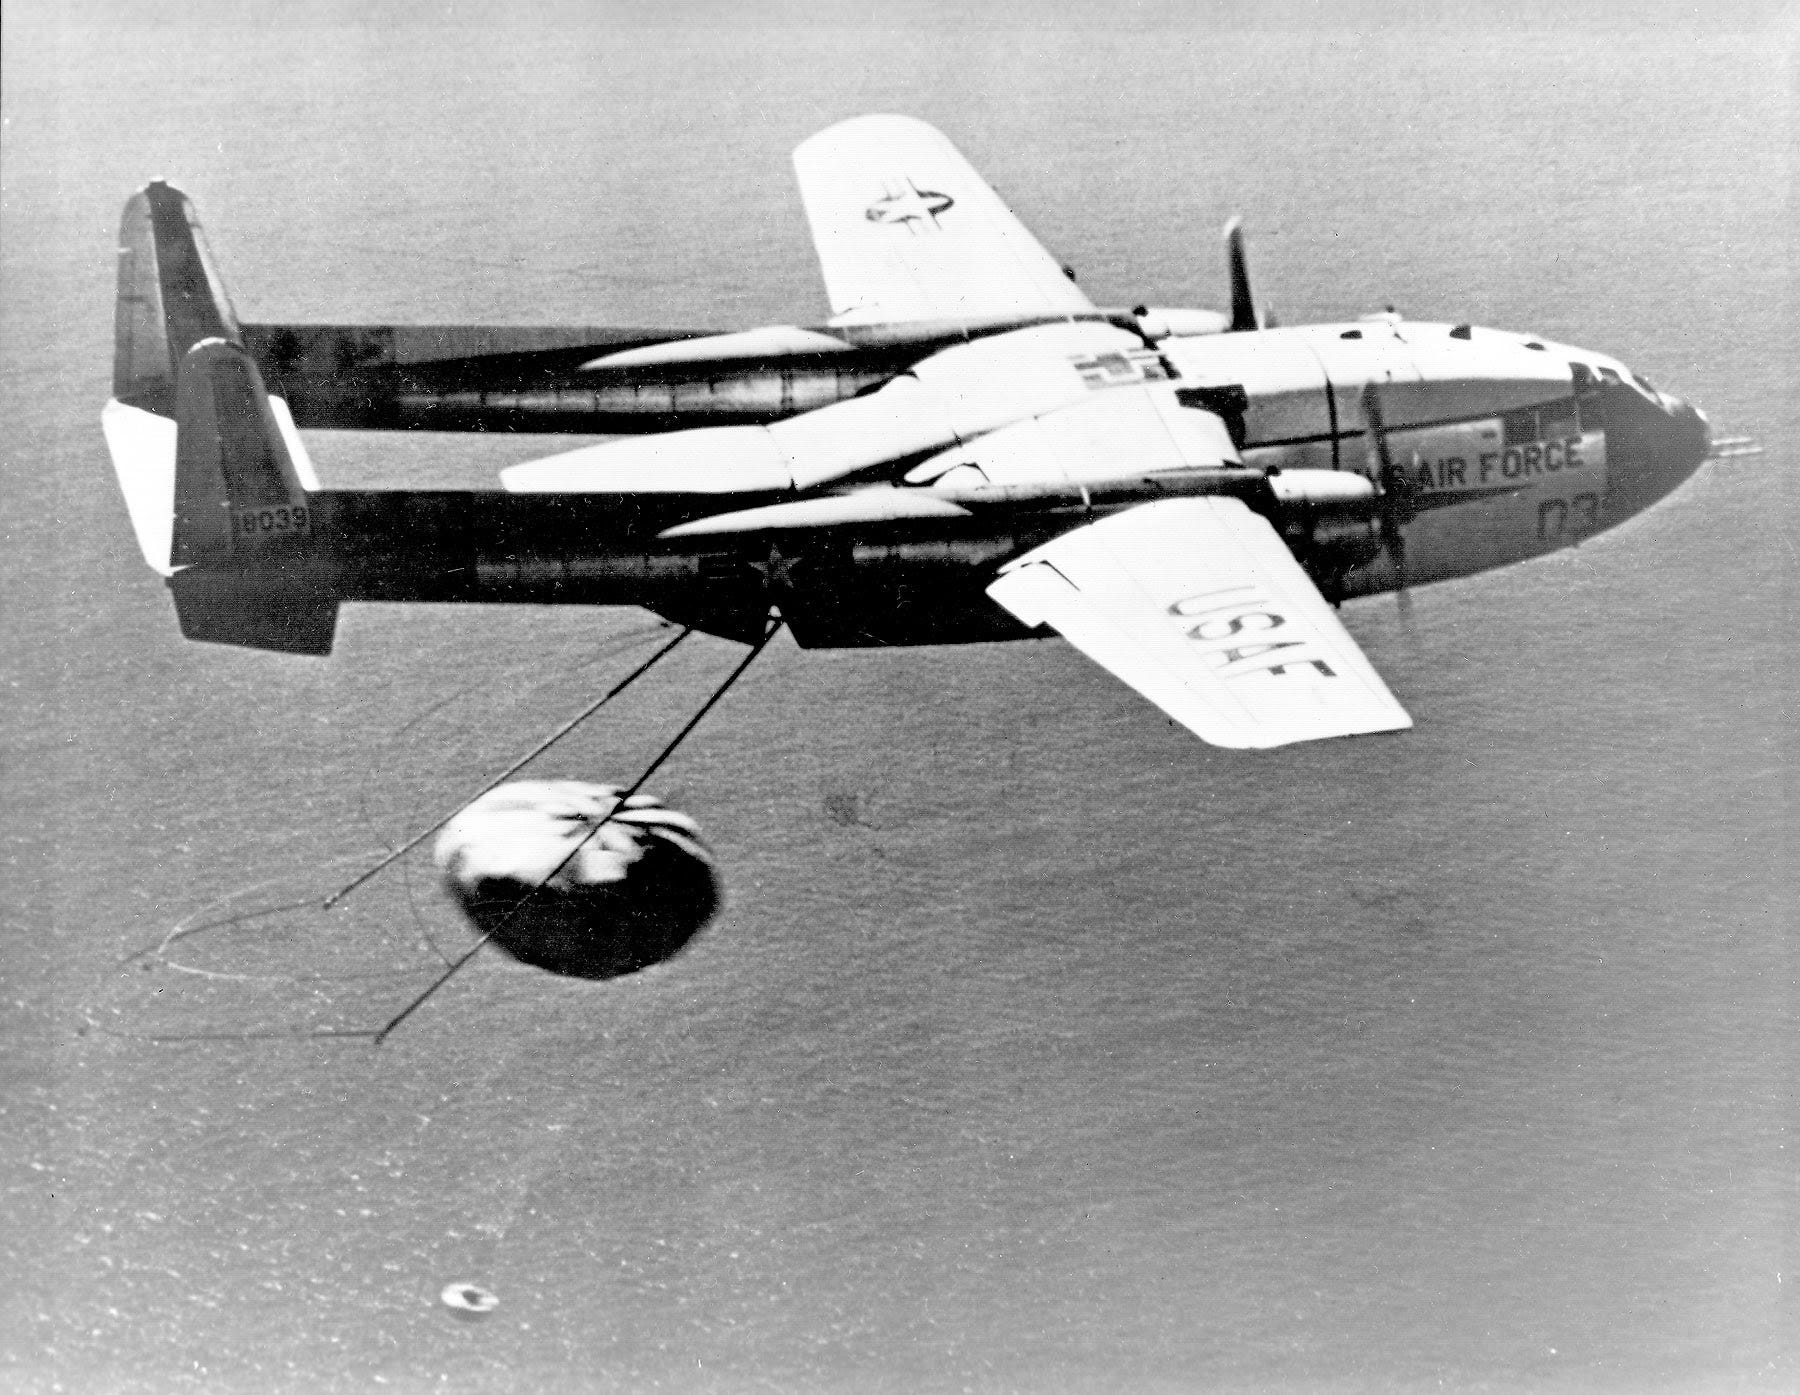
We have been using satellites to observe our planet for more than 60 years3. Before it was possible to transmit remote sensing data over high-bandwidth space links, satellites used to drop capsules with films which would literally re-enter the atmosphere and gently come down with parachutes only to be collected mid-air (!) with special aircrafts.
We went a very long way improving not only the collection techniques but also the resolution of the images we take of our planet, as well as spreading the spectrum of the sensitivity of the devices we use to observe it, all the way from radar to different bands of optical wavelengths. Earth Observation can be unpacked into a myriad of use cases: monitoring the oceans, tracking floods, weather forecasting, wildfires, agriculture, disaster relief, deforestation, shipping tracking, infrastructure assessment, and defense surveillance. The latter being, alas, one of the main drivers of the EO industry overall.
So far, the EO industry has been performing similarly to football commentators. This is, observing and commenting on what is happening and more fundamentally what has happened, but largely unable to comment on what will happen. Granted, just like football commentators cannot predict when a goal will be scored, predicting a flood will occur, a bridge will collapse or a ship container will block a massive international waterway is surely hard. Some of those events could be nothing short than Black Swans (very impactful and obvious only after the fact). But many are not. Think of football again: some goals come out of the blue, from the unexpected individual genius of some talented player, or pure luck. For many other goals, you can see the build up, and without really knowing exactly when, you know your team will sooner than later succumb.
Equivalently, there are happenings on our planet we cannot accurately predict but we can monitor for their build up. Bridges or dams collapsing do not happen in such an instantaneous single-step manner that they couldn’t be observed to some extent, provided a quantitative way of measuring displacement exists and, of course, something or someone understanding how a normal bridge behaves versus an abnormal one. Floods as well: weather data collection is one of the most mature EO use cases, so if you could inter-operate weather satellite data with water flow tracking, you could at least connect some dots and raise a hand. But, well, interoperability (more specifically, the lack of) tends to be a common issue in space industry. Satellites of different feathers rarely fly together. On the other hand, a shipping container suddenly losing steering authority amid a sandstorm and blocking a massively important canal is harder to see coming.
Nowadays, when something relevant happens, you see most EO actors in the industry rushing to go and over-observe what has already happened. Mind you, this is still of great use. But, it boils down to what the football TV does after a goal or a situation worth revisiting: replaying with many different cameras and crystal-clear resolution, multiple times and from multiple directions. The goal has happened, and if you are on the suffering side of the match, the replay does nothing else than rubbing it in. Enough already, right? Unless the VAR4 kicks in and you breath again. We don’t have the VAR when it comes to planetary events, we can’t roll back. Replaying can still serve a good purpose for aftermath analysis and for guiding relief efforts.
As technology progresses and disciplines such as Artificial Intelligence and Statistical Learning slowly mature into something else than mere buzzwords to attract investors, the EO industry is starting to shift into analytics and tracking. This is, the capability of detecting if something has changed from some past observation, and quantitatively assess such differences. This comes with the greatest challenges of them all: turning pixels into identifiable, trackable objects. When you take a picture of your dog, what you get is a collection of bytes which basically mean nothing by themselves. Now, when you happen to know what those bytes mean, you can turn those amorphous numbers into an image you can eyeball. We as humans are great at visually extracting features and objects from images, so we can understand where the dog starts and where it ends, where the rug is, the window, and the TV. If you took a hundred images of your dog in a short sequence, you would even be able to notice how things have changed between those multiple frames: your dog’s tail movement, someone passing by in the background, a curtain moving, a difference in shadow, at least at a qualitative level (without measuring exactly how things have moved in millimeters). A scene with your dog in your living room is a pretty simple scene with a relatively simple geometry. Now try to think about a metal box orbiting at 500km above the surface of the Earth and taking a picture from there. The complexity of the scene is mind boggling. And so it is the objectification task of such a scene: what is what after all? There will be vehicles, bridges, people, clouds, buildings, ice, water, land, and all with varying angles as the satellite flies over following slightly different paths as Earth rotates underneath it. The higher the resolution, the more features you are able to discern.
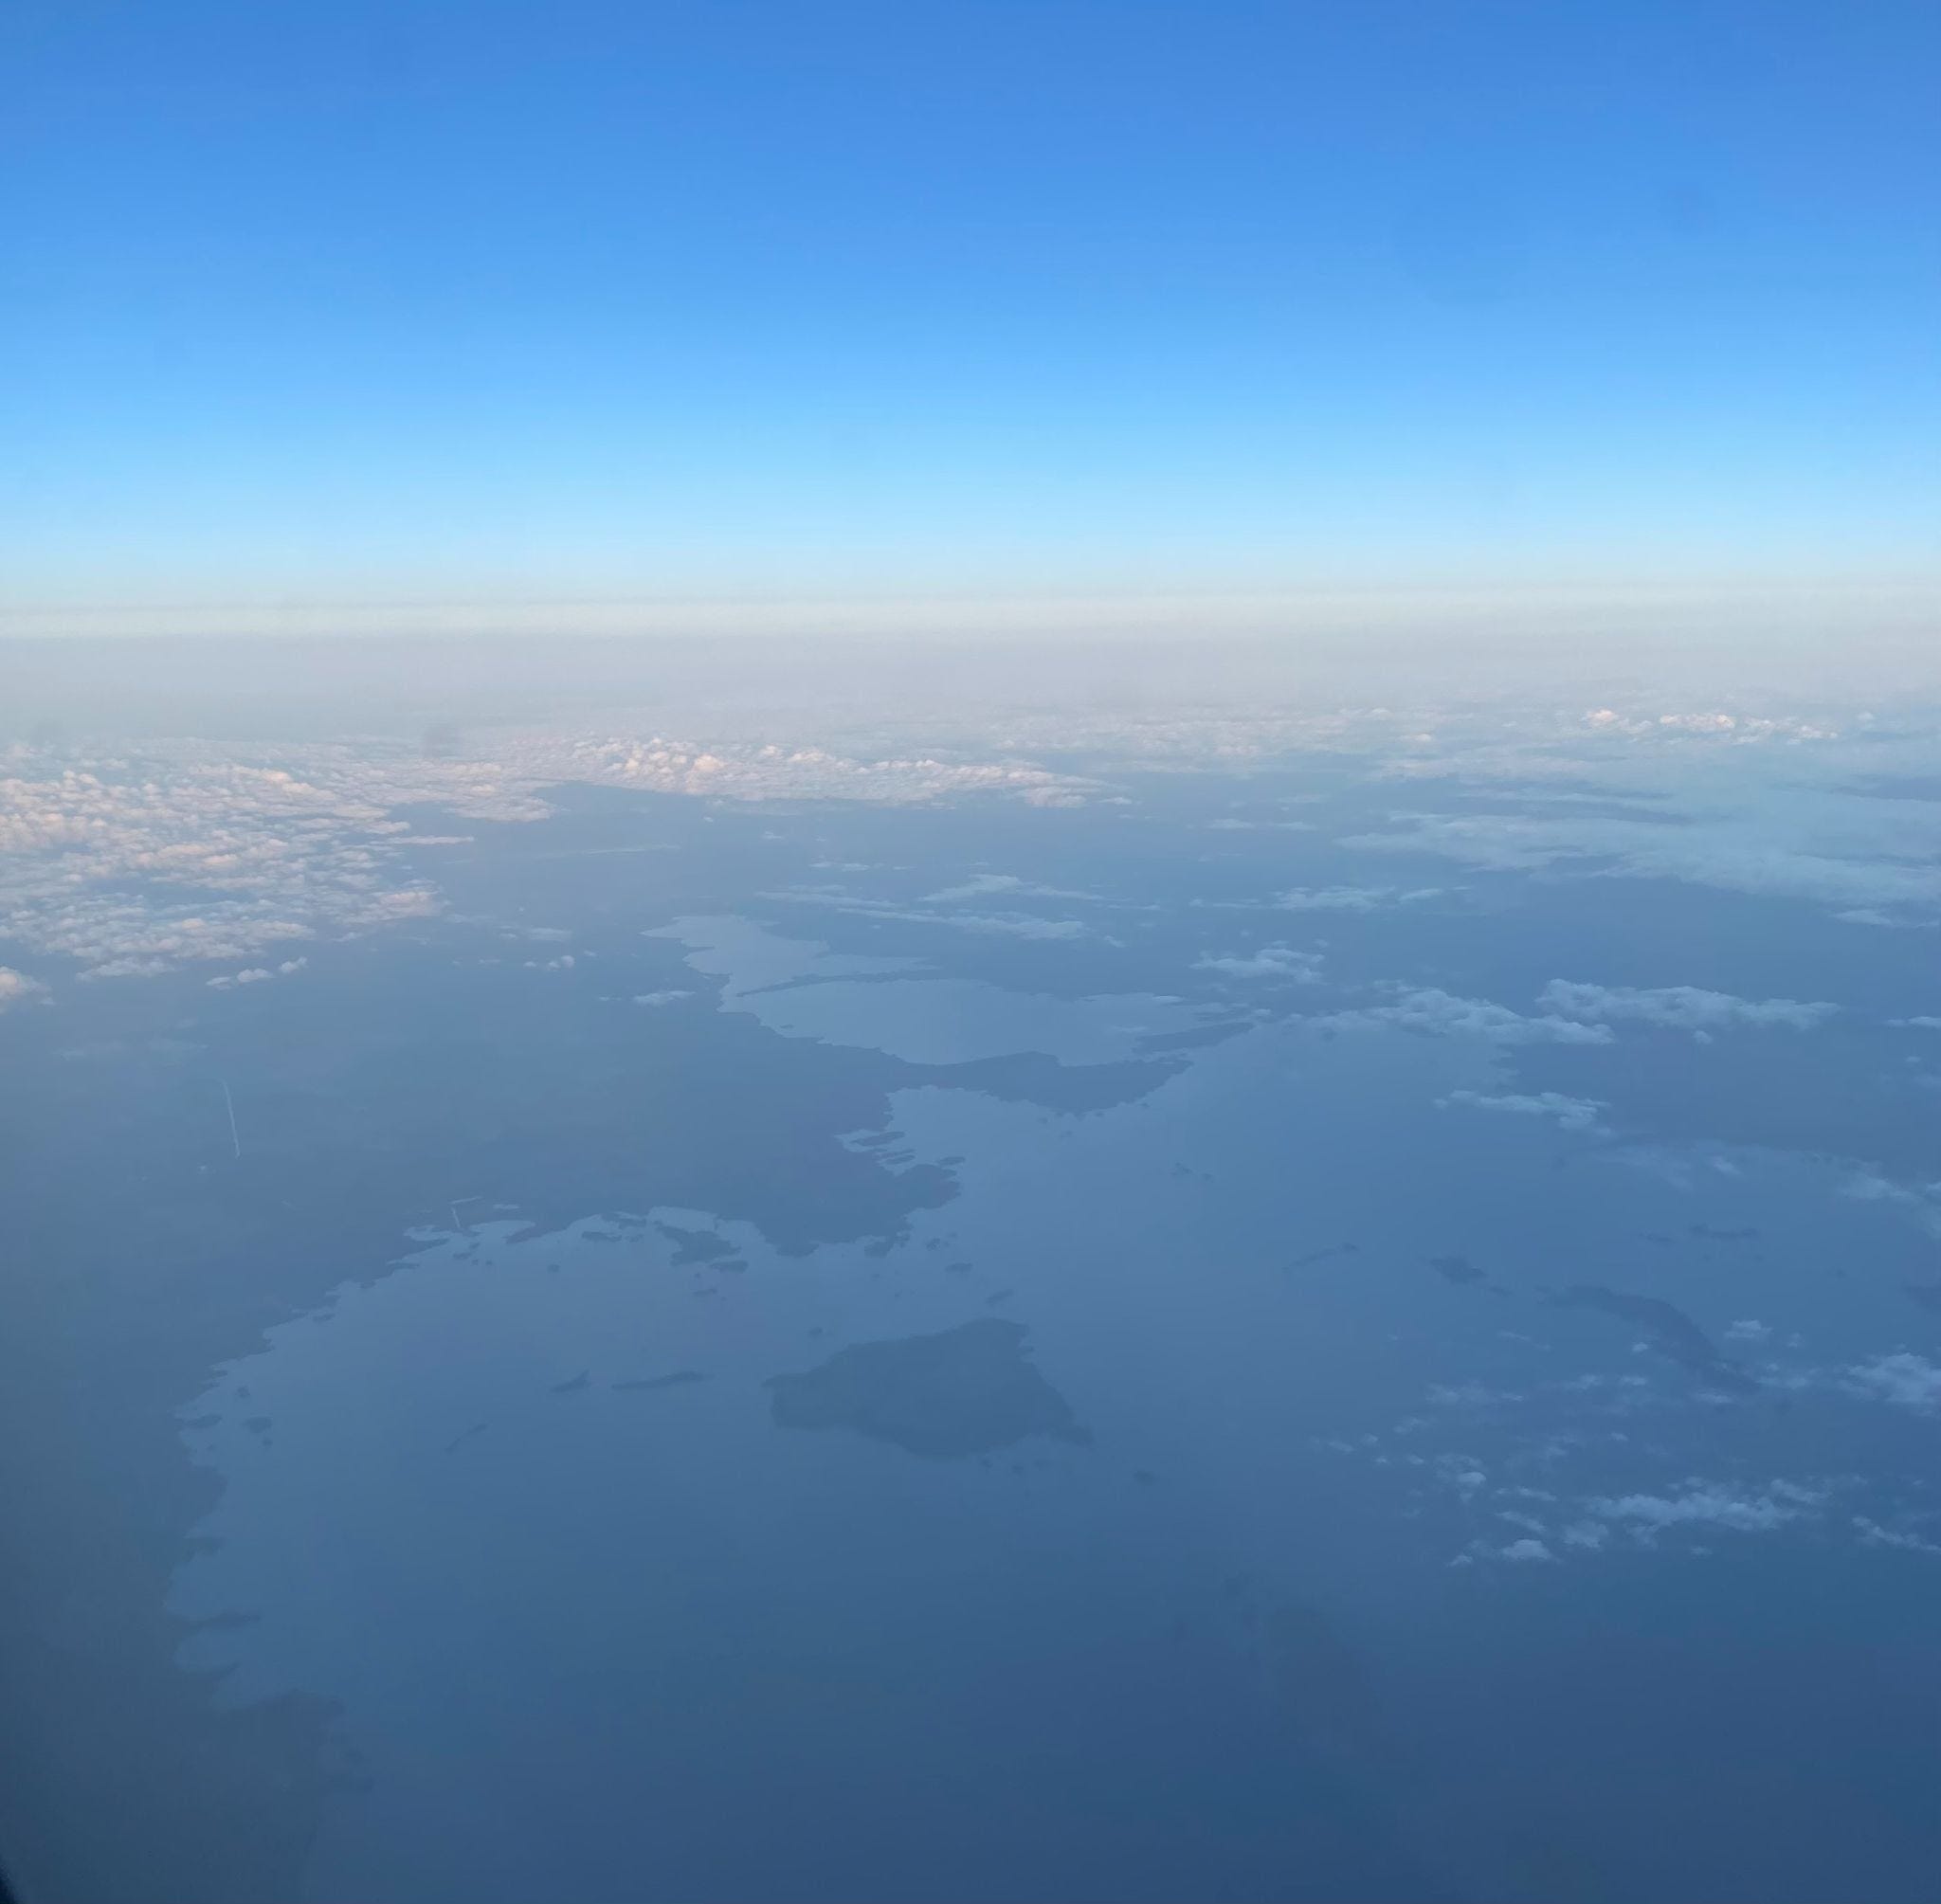
Many years ago, Lewis Richardson wanted to measure the coastline of Britain, and he found that the higher the resolution, the longer the measurement he got. How so? Unlike a living room, most borders and coastlines are not straight lines. Rather, they are squiggly meandering lines either following local geography or having “arbitrarily” been determined via politics, culture, or history. If you lay a straight ruler of length 100 kilometers between two points on a coastline or border, as is effectively done when surveying, then you will obviously miss all of the many meanderings and wiggles in between. If, however, you were to instead use a 10-km-long ruler then you become sensitive to all of those meanderings and wiggles that you missed whose scale is bigger than 10 km. This finer resolution can see these finer details and follow the wiggles, thereby leading to an estimate that is necessarily larger than that obtained with the coarser 100-km scale. Likewise, the 10-km scale will be blind to similar meanderings and wiggles whose scale is smaller than 10 km, but which would be included if we increase the resolution to one kilometer, leading to a further increase in the length. Thus, for lines like the borders and coastlines that Richardson studied with many squiggles, we can readily understand how their measured lengths continuously increase with resolution. Similarly, the amount of features observed as we increase resolution of satellite imagery increases, turning the objectification of the data more cumbersome and time consuming as well because the amount of data generated will most likely increase, making the processing of such data harder, let alone tracking all that. As I write this article, I am flying to Gothenburg and I cannot help observing through my window the beauty of the wiggly land of Sweden showing up and wondering how long its coastline might be. The answer? It depends.
Richardson’s discovery was almost entirely ignored by the scientific community back then. Not too surprising considering the somewhat obscure title: “The Problem of Contiguity: An Appendix to Statistics of Deadly Quarrels”5. Who was to know that this paper was to create a paradigm shift of major significance? Well, some guy called Benoit Mandelbrot6. And the rest is history: the history of fractals.
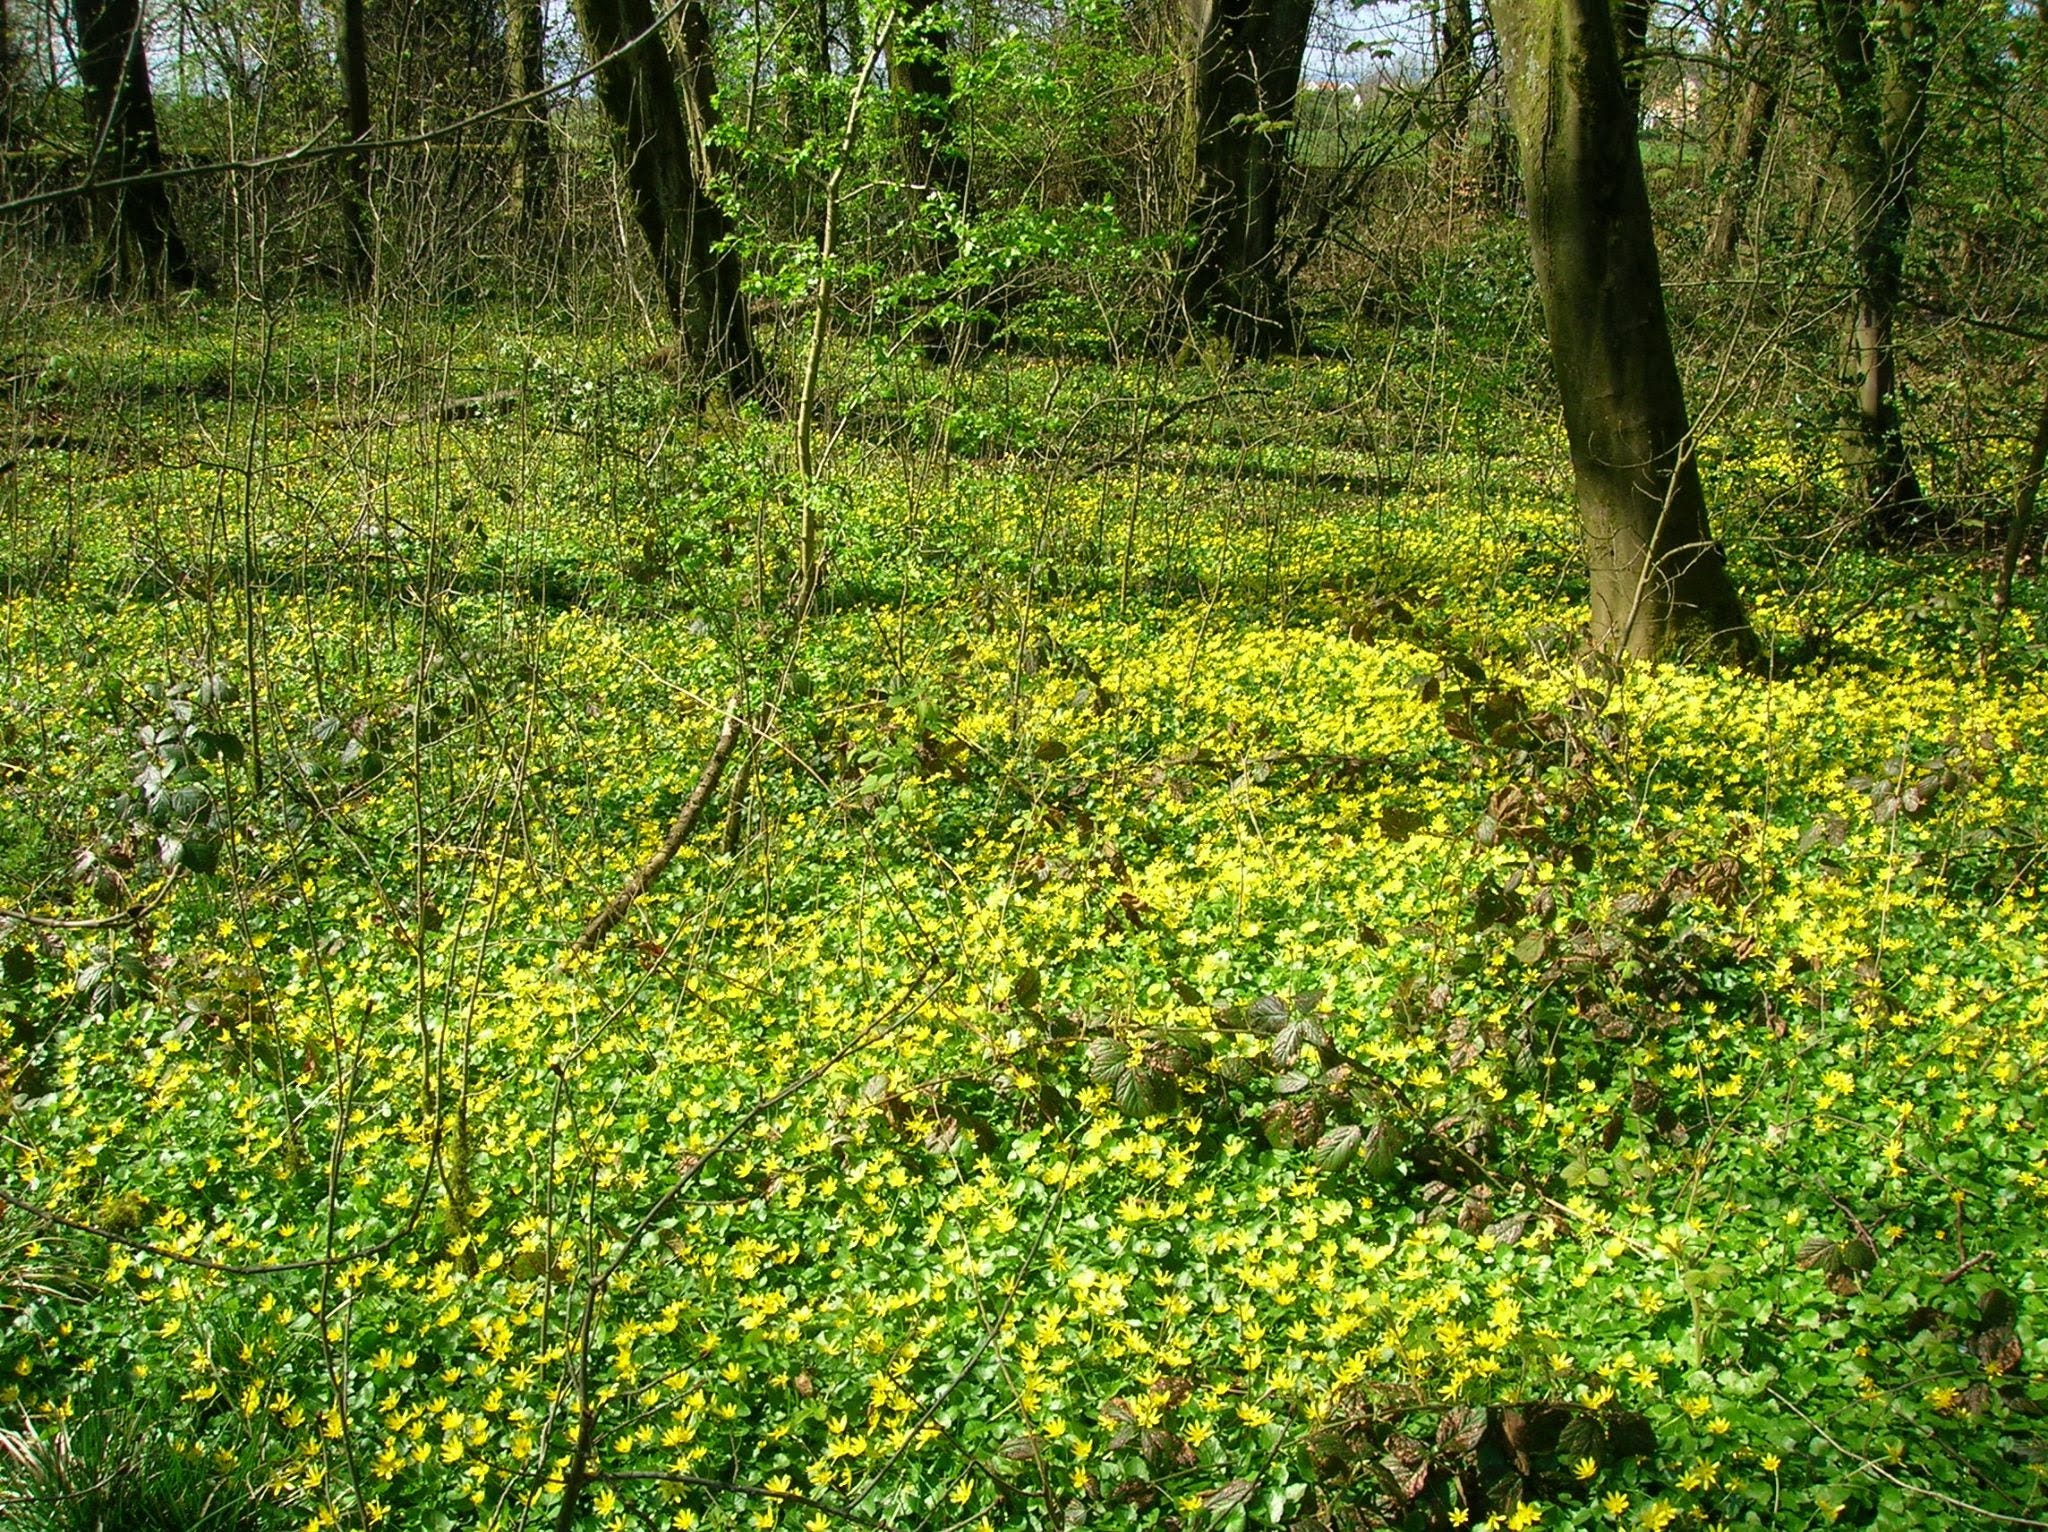
Our planet, under the magnifier, is self-similar: the more you zoom in, the more the area you look at reveals contents which look the same as in the previous zoom level, broccoli-style. When I was a kid there was this movie called “Honey, I Shrunk the Kids” where this mad scientist accidentally shrinks his kids into the tiniest size, smaller than ants. The adventure takes the shrunk folks into their backyard, which now looks like a full blown tropical forest from their perspective (special mention to the scene where they need to fight a “giant” ant). Forests have what’s called the understory vegetation. At the right scale, the understory looks like the forest itself. Self-similarity at its best.
This is why I tend to find the “resolution wars” you see between different EO actors in the industry somewhat curious. What they are announcing when they shout they are imaging at a higher resolution is remarkable, but it basically means that their ruler got smaller, hence their “coastline measurements” have definitely increased. What does that mean? It means the complexity of the data they are collecting has grown and the challenges to extract features are now under higher stress.
Consistent objectification and tracking of features from image data is a greater stunt than the size of the ruler used. An EO company showing they are able to understand what a bridge is, where it starts and where it ends, able to recognize wind farms and their power output; well that’s impressive. Satellites being -finally- able to see, not just spout pixels, that’s the real deal. Seeing (again, in italic) here is understood as comprehending not only the object tracked but also its dynamics: how much does a normal bridge move versus one which is about to collapse? What if it’s a movable bridge? The same basically applies to any other object identifiable: there is a “normal” dynamics and behavior of the object versus an abnormal one. Or a dynamics which indicate low-activity, or unusually high activity which can hint a build up of sorts. Somehow, such dynamics has to be embedded somewhere in the detection process if we want to avoid an actual pair of human eyes to make some sense. What’s more, a proper objectification may require multiple sources: not only images in multiple spectrums (radar, hyperspectral), but also GPS, AIS, GIS, and what have you.
Is it that the future is actually for those who can interoperate and fuse multiple-sourced data?
Extending the concept to the extreme, even an imaginary, perfect Earth Observation magical “device” which could observe every single square millimeter of the surface of our planet at every second would be largely pointless if it could not discern by itself —this means, without a human eyeballing such gigantic dataset— where the dog starts and the dog ends and if the dog is happy or not from the wagging of its tail.
Ironically, now that I am back at the surface of the Earth I can get to know that the coastline of Sweden is about 3,218 km.
I am leaving purposely out scientific missions here.
The term Earth Observation is used in two ways, leading to some confusion. In Europe, in particular, it has been used to refer to satellite-based remote sensing, but the term is also used to refer to any form of observations of the Earth system, including in situ and airborne observations. In the US, the term remote sensing is used to refer to satellite-based remote sensing, but sometimes used more broadly for observations using any form of remote sensing technology, including airborne sensors and even ground-based sensors. Perhaps the least ambiguous term to use for satellite-based sensors is satellite remote sensing (SRS), an acronym which is gradually starting to appear in the literature.
Although you could say Sputnik-1 was an Earth Observation satellite, the first satellite to carry a camera for surveillance purposes was the Corona program of classified satellites.
Richardson was more into researching war and conflict than fractals. Mandelbrot was more into researching the mathematical origin of fractals and not much into why those form in nature.